5 Examples of Bad Data Visualization to Avoid
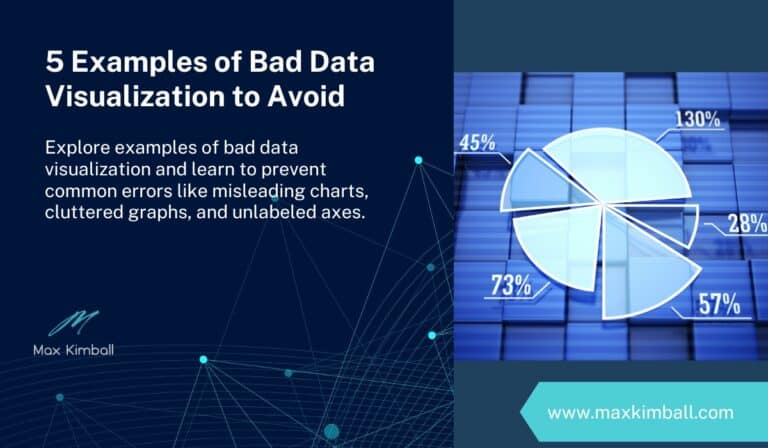
Explore examples of bad data visualization and learn to prevent common errors like misleading charts, cluttered graphs, and unlabeled axes.

Explore examples of bad data visualization and learn to prevent common errors like misleading charts, cluttered graphs, and unlabeled axes.

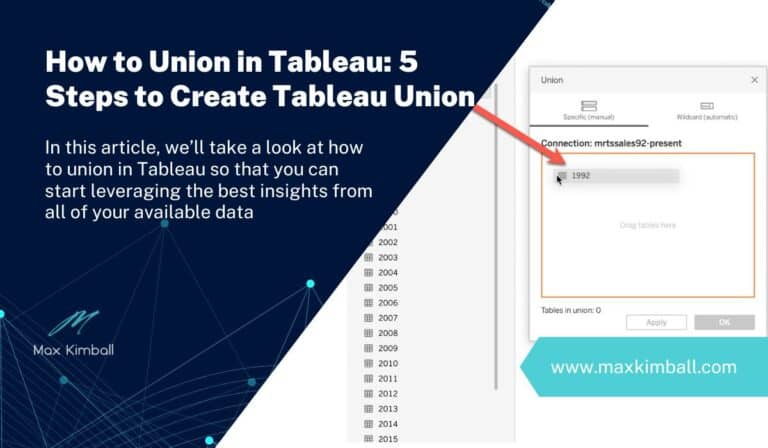
Tableau is a powerful data visualization tool that can help you uncover insightful trends and patterns in your data. One of the most useful features Tableau offers is the ability to union multiple datasets together, allowing you to combine information from several different sources into one comprehensive view. In this article, we’ll take a look…

If you’re looking to improve your business intelligence skills, there are a variety of great books out there. In this blog post, we’ll rank the 7 best books on business intelligence and business analytics, based on customer reviews and ratings. Whether you’re a beginner or an experienced professional, these books will help you take your…

Are you an analyst who often works with data in Tableau? If so, then you may be familiar with the TWBX file extension. But what is a TWBX file and how do you open one in Tableau? Keep reading to find out how to open TWBX file. What is a TWBX File in Tableau A…

Businesses today are under constant pressure to make data-driven decisions. This has made business intelligence (BI) a critical function for organizations of all sizes. IBM is a leading provider of BI solutions, and its Business Intelligence Strategy is helping businesses transform their data into actionable insights. In this blog post, we’ll take a look at…

Do you want to become a data scientist? If so, you’re going to need the right tools for the job. In this blog post, we will discuss the 7 best computers for data science in 2023. These machines are perfect for crunching numbers and performing complex calculations. So, if you’re serious about pursuing a career…